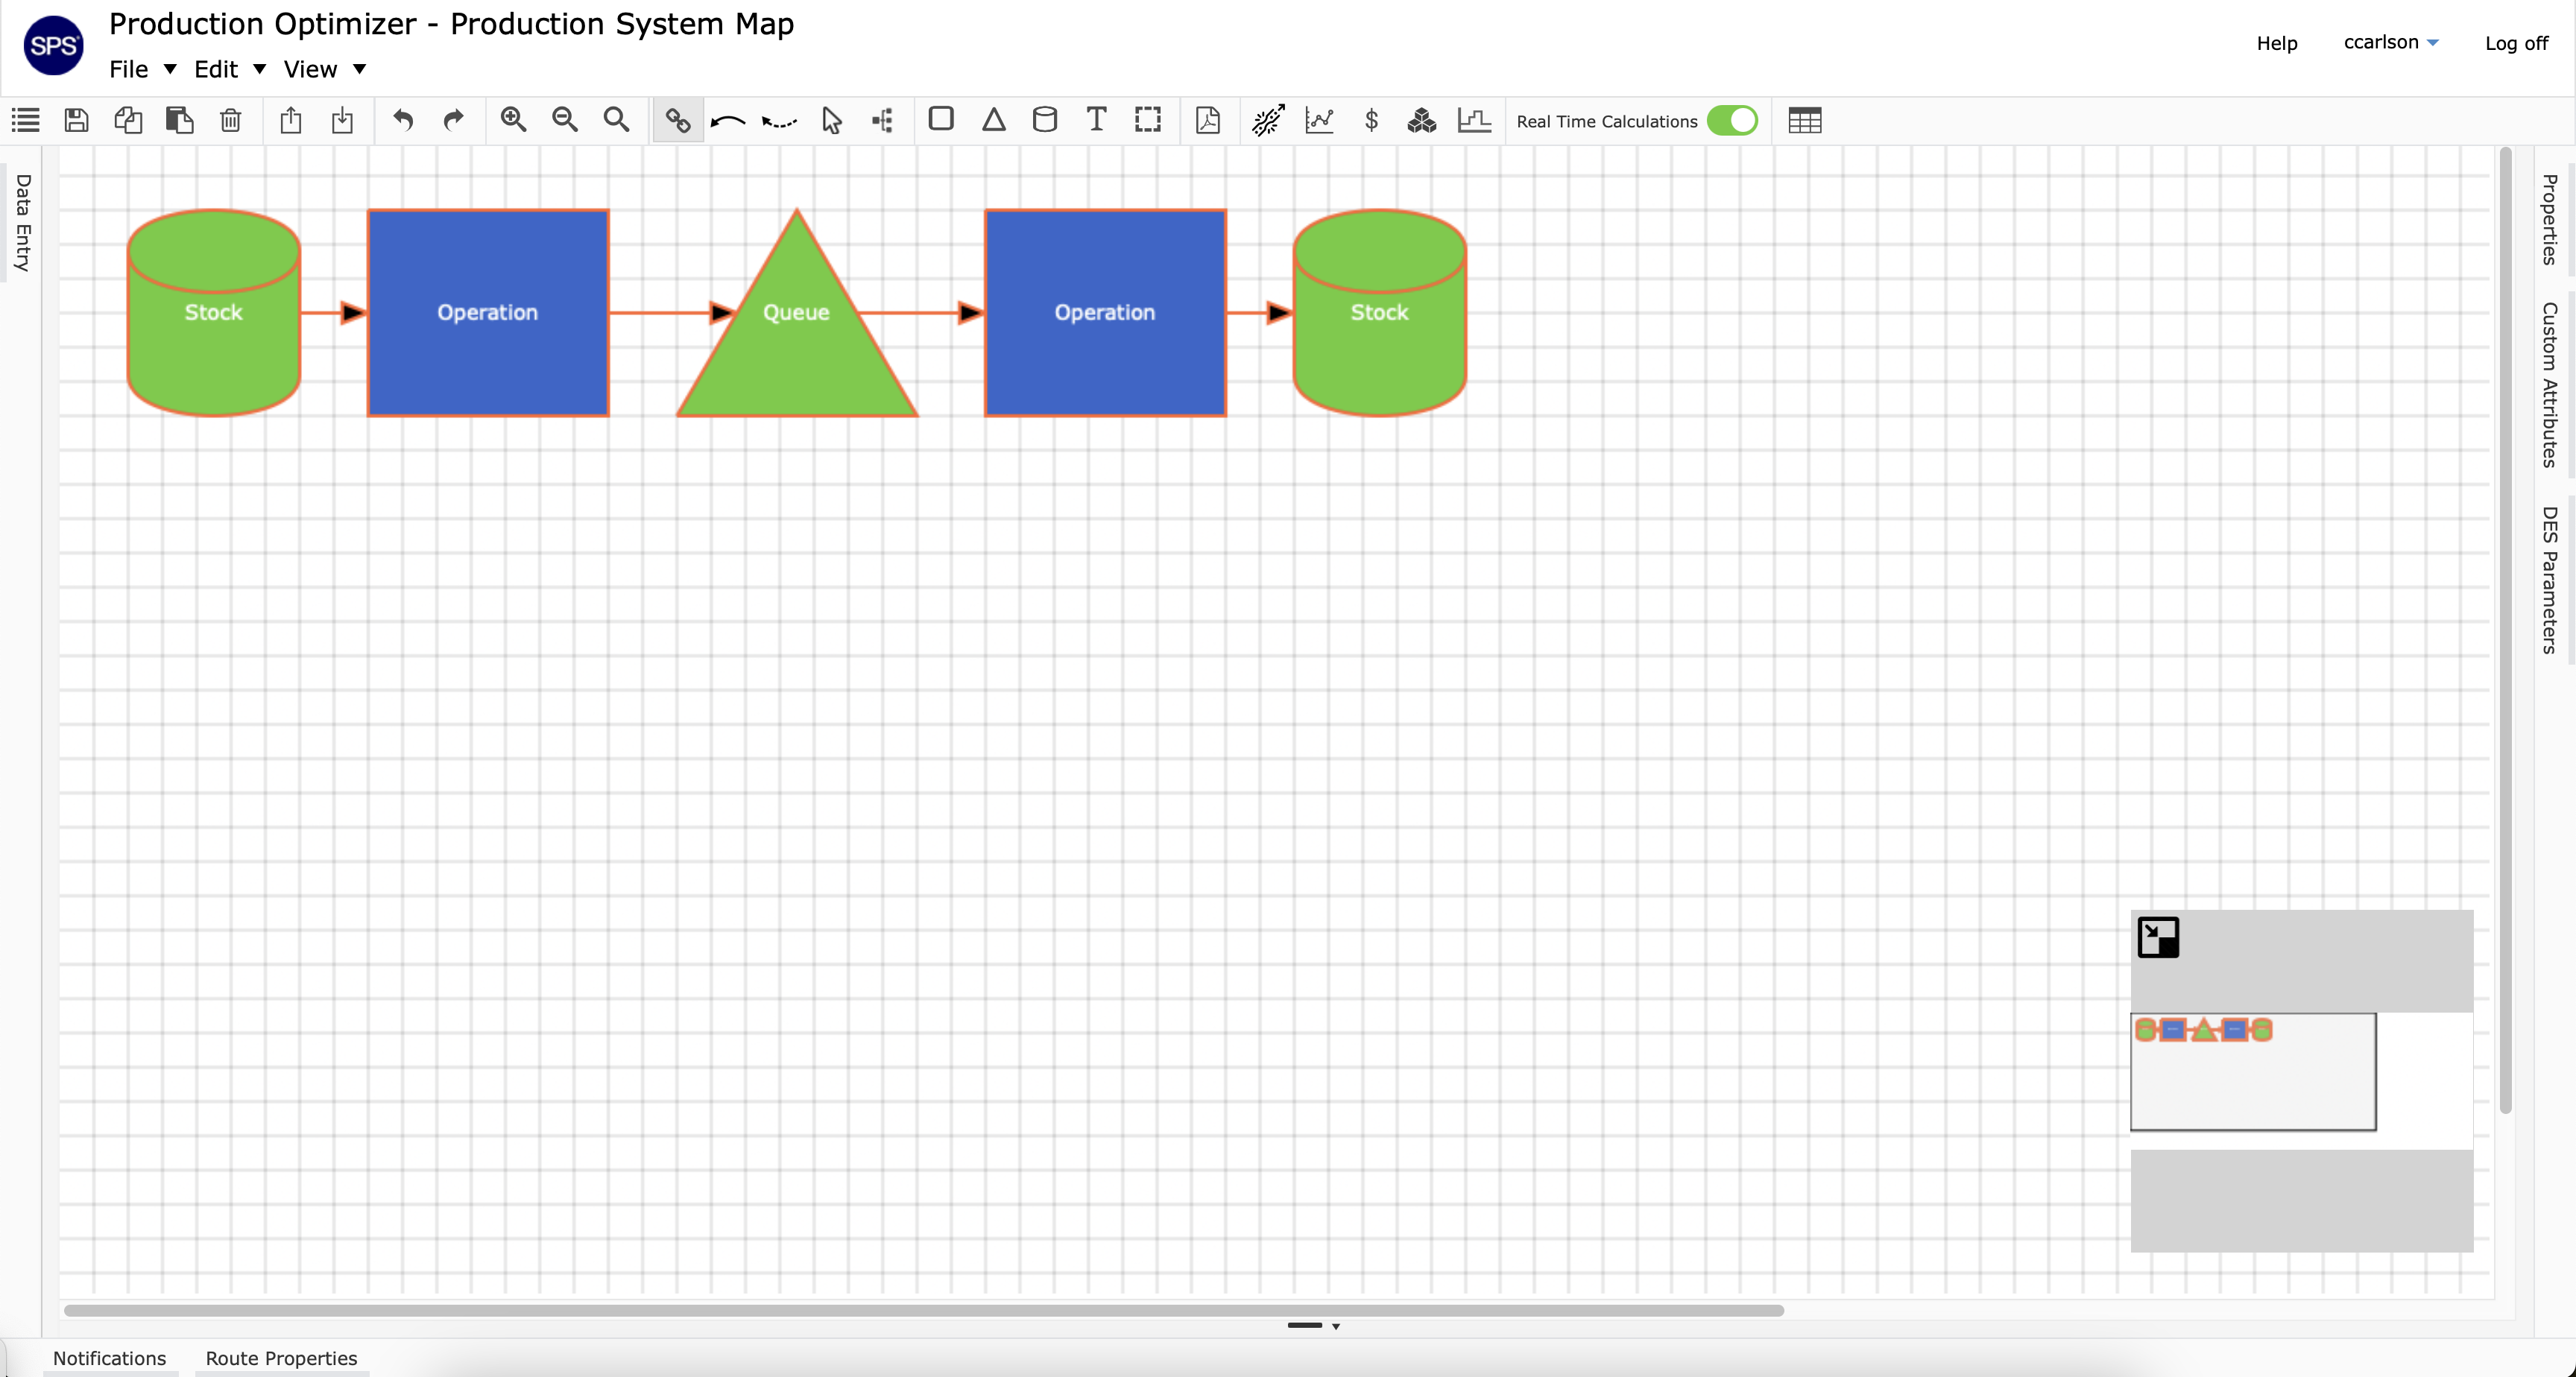
First begin by selecting the Stock shape icon. Place your cursor over into the grid area and double click anywhere to generate a Stock. Your process should resemble the following.

Next, select the Stock by clicking it once. You should see a box form around the Stock and an arrow appear to the right of the Stock.

Select the arrow to the right of the Stock to automatically generate an Operation and a Queue.

Continue this sequence until the desired number of Operations for the process has been drawn. This tutorial will stop at two. Your process should resemble the following.
Note: the user does not always need to use the auto-generation of Operations of Queues illustrated above. This function is available to accelerate process creation. All shapes can be generated independently by selecting the shape icon and double clicking in the grid area.

To complete the process, the user will need to end the process with a Stock. First start by selecting the last Queue. Then press the delete button in the toolbar or the delete or backspace buttons on your keyboard. Now, select the Stock shape button and double click in the grid area to create another Stock. Your process should resemble the following.

Now, select the Link tool from the toolbar. Hover over the last operation until the 4 dots appear on each side. Click and hold then drag the arrow to the Stock shape and release your mouse over the Stock to complete the connection. Your process should resemble the following.
Notice that the process is now outlined in red. This indicates that the system has recognized the creation of a routing. The routing here, is every shape outlined in red.

Sequences of shapes can be duplicated by first selecting the Modify tool. Now, click and drag to select multiple shapes within the grid and select the copy button and then select the paste button. Once pasted, the new shapes will automatically be pre-selected so that the user can move them to a different location. Simply hover over the new shapes until the cursor turns into a cross. Then select and hold to drag the shapes to a new location.
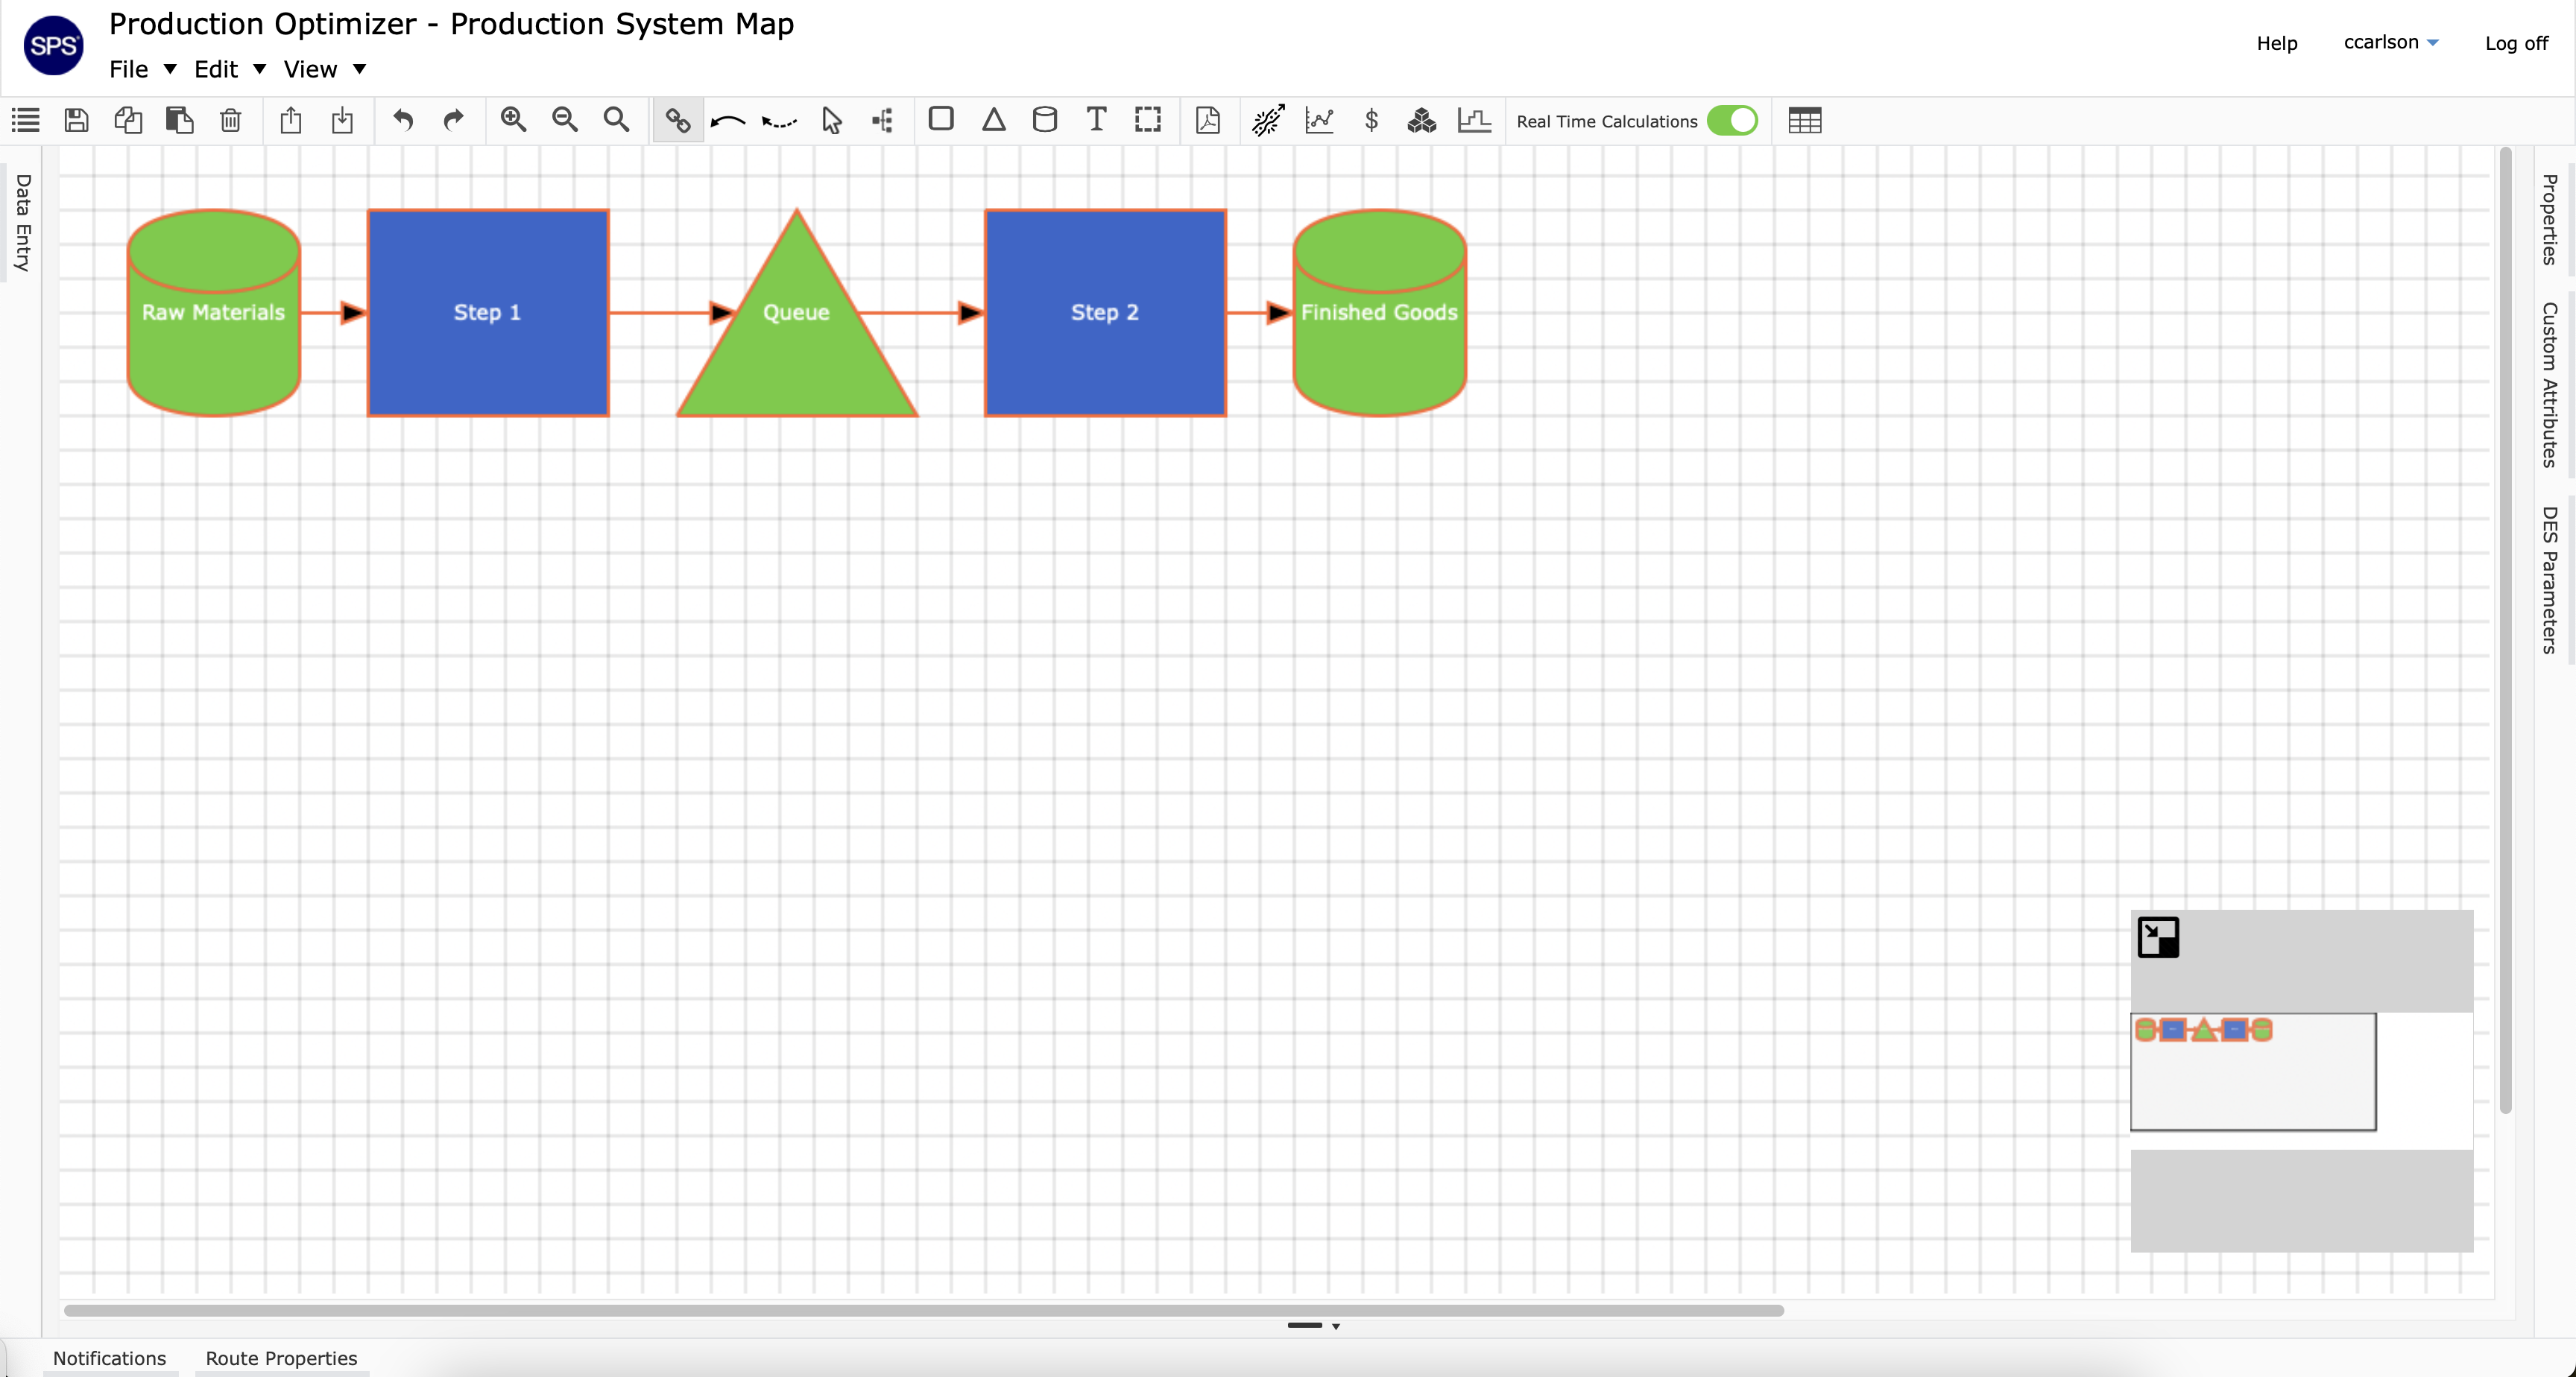
Editing Shape Text
The text within any shape can be changed by double clicking the shape to open the text editor. After changing the text, click outside the shape to finalize.


Process Maps Should Be Drawn With Production Units In Mind
Keep in mind that the purpose of mapping a production process is to focus on the production system. Process maps should clearly describe the items that move into a production process, how they are transformed, and what they are transformed into when they exit the process. The goal here is to focus on production and not recreate a project schedule or a production schedule. In both production and project environments a singular process can be repeated as many times as there are production units in the scope. Each unique process is drawn once and using Items and Item Routings, many production units will be sent through them.
Rules for Connecting Shapes
First, there must be a queue or a stock between any two operations. Within a routing, queues will naturally form between any two operations due to the variability in processing times and production policies between the operations. Operations will be connected to stock points at the beginning and end of a routing to depict the entering of pre-transformed production units into a process and depict transformed production units out of a process.
Second, queues are not connected to stock points. The system assumes that production units can move from the last process immediately into the ending stock point. If there is some waiting period or move time associated with this transfer, that time can be captured by Move Time or by additional Process Time. The same assumption applies for production units entering the system. Production units will not enter the system until they have the ability to do so.

Proper Naming of Shapes
To keep production language consistent throughout the model, process step names should begin with an action verb followed by the object that the action is done to. This is meant to capture the physical act that is done to the production unit. Stock points should be named in a manner that describes the items that are contained in the stock. In a situation where many different items are accumulated in a stock point, it is acceptable to label the items at a higher level.

Choosing Between Queues or Stock Points
Stock points must be used instead of queues any time there is 1) an item change, 2) a batch size change, or 3) a decision made to purposefully stock inventory. Otherwise, use a queue.

Process Mapping Considerations
When drawing a production system map, consider the following things.
What is the objective of the mapping / modeling effort? This directly impacts the level of detail that will be necessary in the map.
What information and assumptions are available to map / model a process? A process can be drawn in detail proportionate to the information available.
What are the inputs and outputs of each part of the process, and each “sub-process”? Inputs include information, approvals, materials, parts, and assemblies. Outputs can be identical to inputs. The outputs of one “sub-process” become the inputs to another.
How do items physically move throughout a process? Items can move one at a time or in batches (groups). They can be moved by a person or a machine. They can move immediately, or wait some period of time due to a set policy or lack thereof.
What protocols and mechanisms are in place and what decisions are made that dictate when and how information and materials move through a process? Protocols often describe a desired behavior. Mechanisms are used as a signal to start or stop an operation. Decisions can often appear in the form of an approval process.
At which points in a process does responsibility transfer outside the organization? How much detail is available once responsibility is moved? Some variables are entirely outside of the user’s control. However, it is important to know which those variables are.
Process Map Analysis
Much can be understood about a process by studying its process map. When drawn correctly, a process map can reveal risk and opportunity. Below is a list of questions that can be used to analyze your production system map and identify if any important information is missing.
- How complex is the process? Is the complexity necessary and can it be simplified? Does the complexity contribute to high process variability?
- Do choke points exist? Are there multiple flows that come together in a single point? Does this choke point constrain one or multiple flows downstream? How is this choke point being buffered?
- What policies signal the start of each flow? Who controls the policy? How does that affect the system as a whole?
- Where might there be a large buildup of inventory (stock and work-in-process)? What problems or slow-downs traditionally occur at each point?
- What processes usually take longer than others?
- What processes usually require large amounts of space?
- How do supply and transformation connect with one another?
- What processes are controlled or constrained by external parties?
